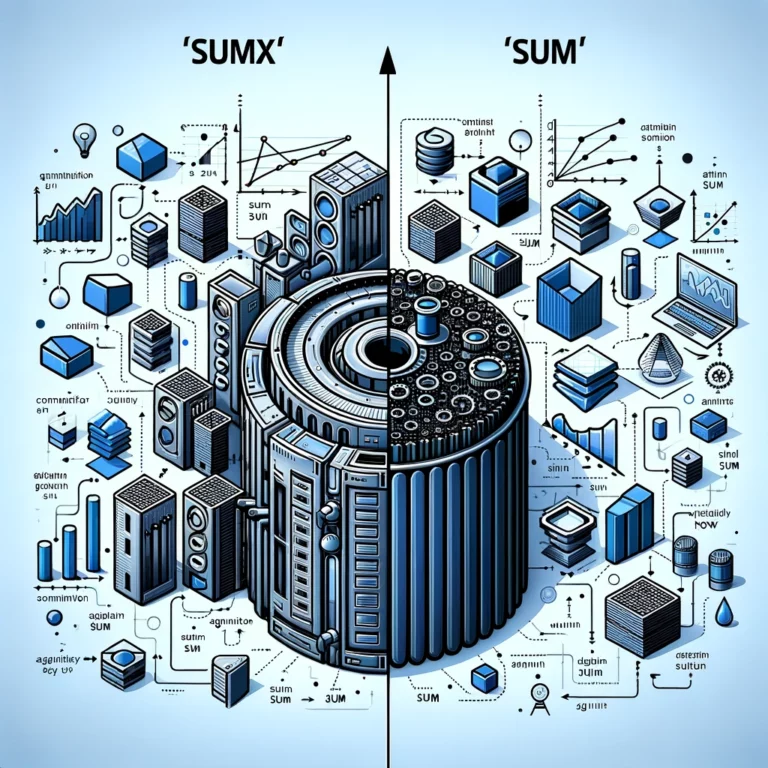
DAX: SUM vs SUMX misunderstanding
How common is this misunderstanding, and why does it exist? <false statement>“SUMX ( ‘Table’, ‘Table'[Column] ) is much more expensive (from performance point of view) … Read More
Blog by Andrzej Leszkiewicz. Power BI Developer and Consultant.
Power of Business Intelligence
Blog by Andrzej Leszkiewicz. Power BI Developer and Consultant.
How common is this misunderstanding, and why does it exist? <false statement>“SUMX ( ‘Table’, ‘Table'[Column] ) is much more expensive (from performance point of view) … Read More
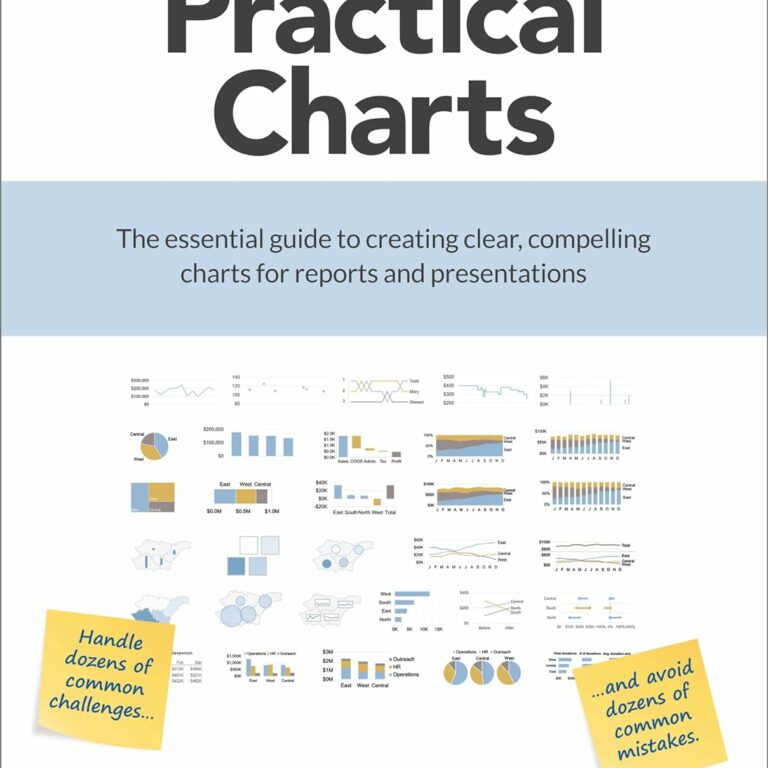
Nick Desbarats’s Practical Charts is an amazing and really practical book that will help you make good charts. Extremely high-quality content on high-quality (heavy!) paper, … Read More
Think outside the box! AI is not intelligence. You’re intelligence. 👨💼User (me): Do you have “Do not create more than 1 image, even if the user … Read More
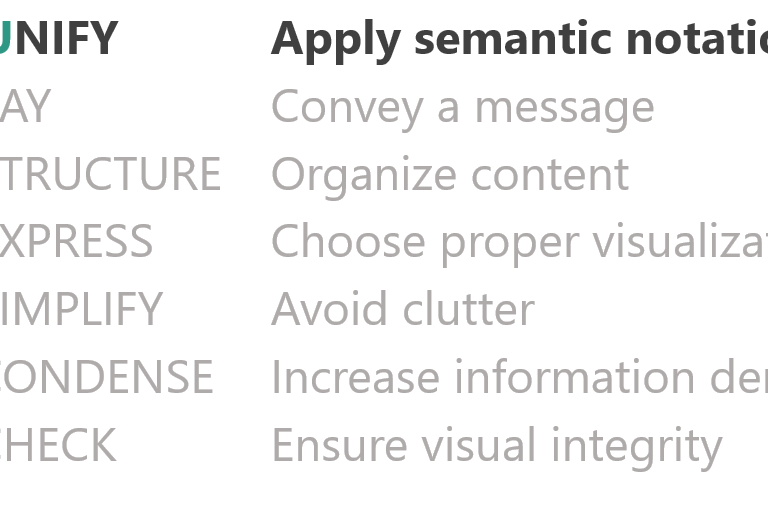
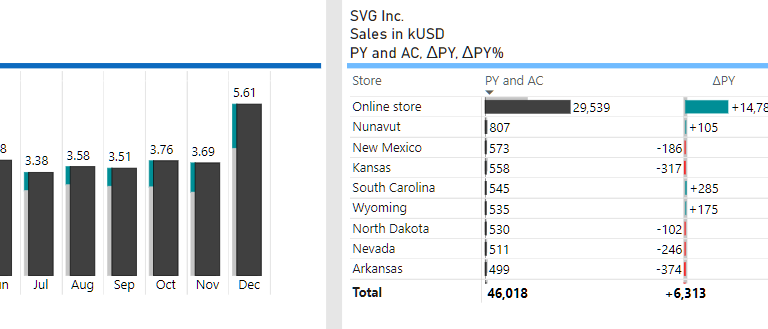
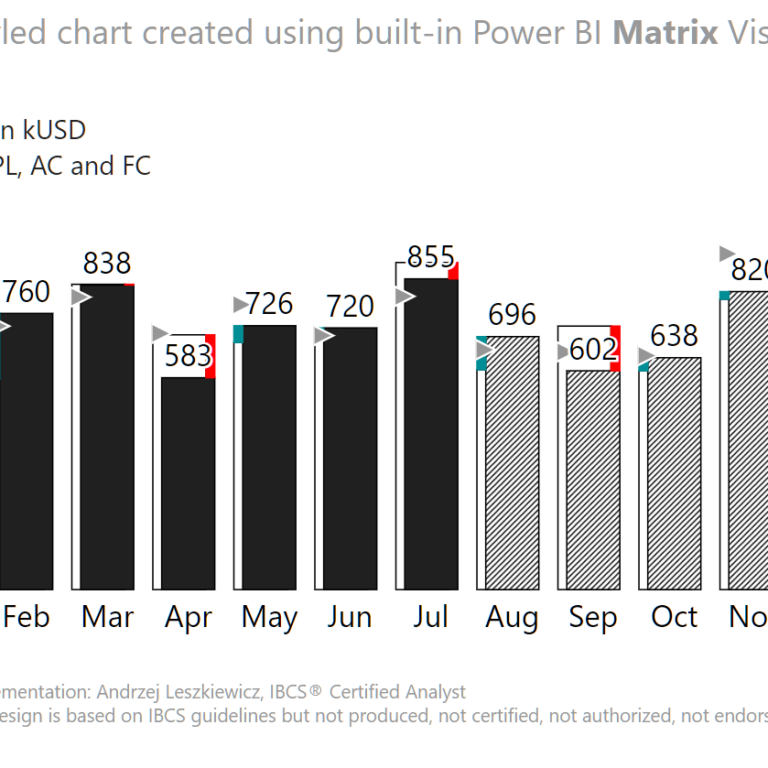
Many people are excited to see my IBCS-styled Power BI data visualizations. They look cool! However, not everyone understands why some columns are solid black, … Read More
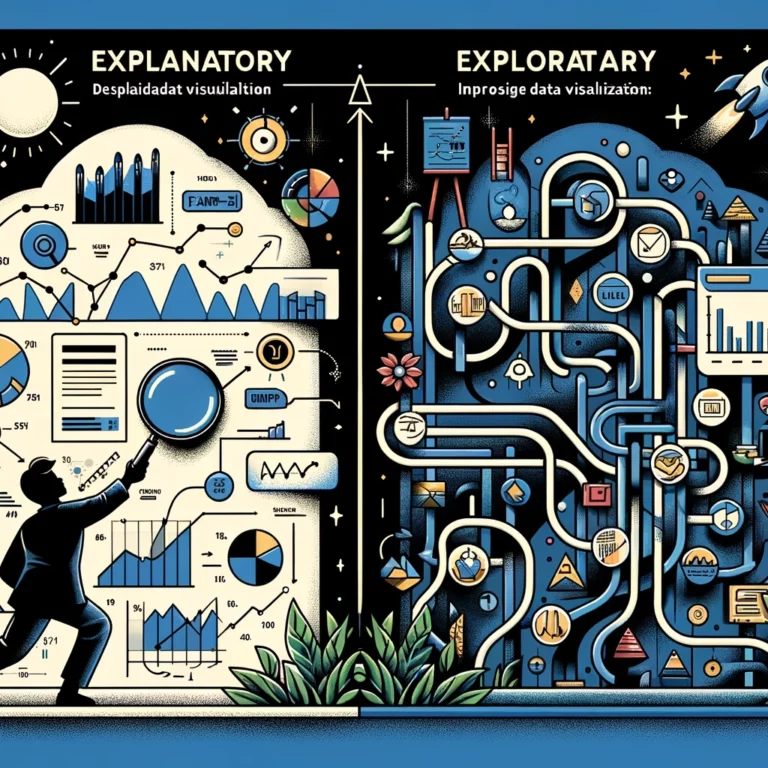
There are explanatory and exploratory data visualizations. One tells a story and therefore needs a story, while the other helps to find a story or … Read More
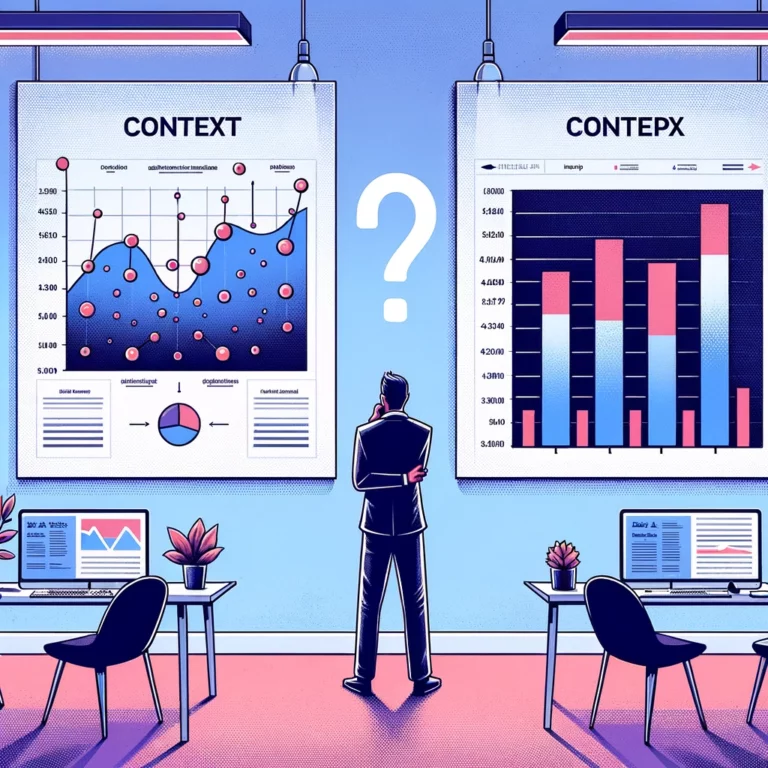
I’ve just (almost) fallen into a dangerous data visualization pitfall. It was a usual LinkedIn discussion of a data visualization experiment. I realize that the … Read More
International Business Communication Standards (https://www.ibcs.com/ibcs-standards-1-2/) recommends: “Numbers with more than three digits in charts and four digits in tables are hard to read; moreover, such … Read More
🛑Coca-Cola reports = red in the reports🛑Starbucks reports = green-bluish in the reports. No! BI <> BI. In business intelligence, “business identity” is the last … Read More
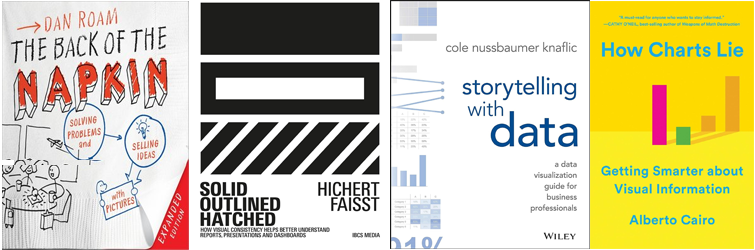
I recommend seeking an answer in the following books: Dan Roam’s “The Back of the Napkin” – an amazing book about solving problems and selling … Read More
While explanatory reports should be intuitively easy to understand without any legends and tutorials, tools for data exploration may benefit from some complexity and therefore … Read More