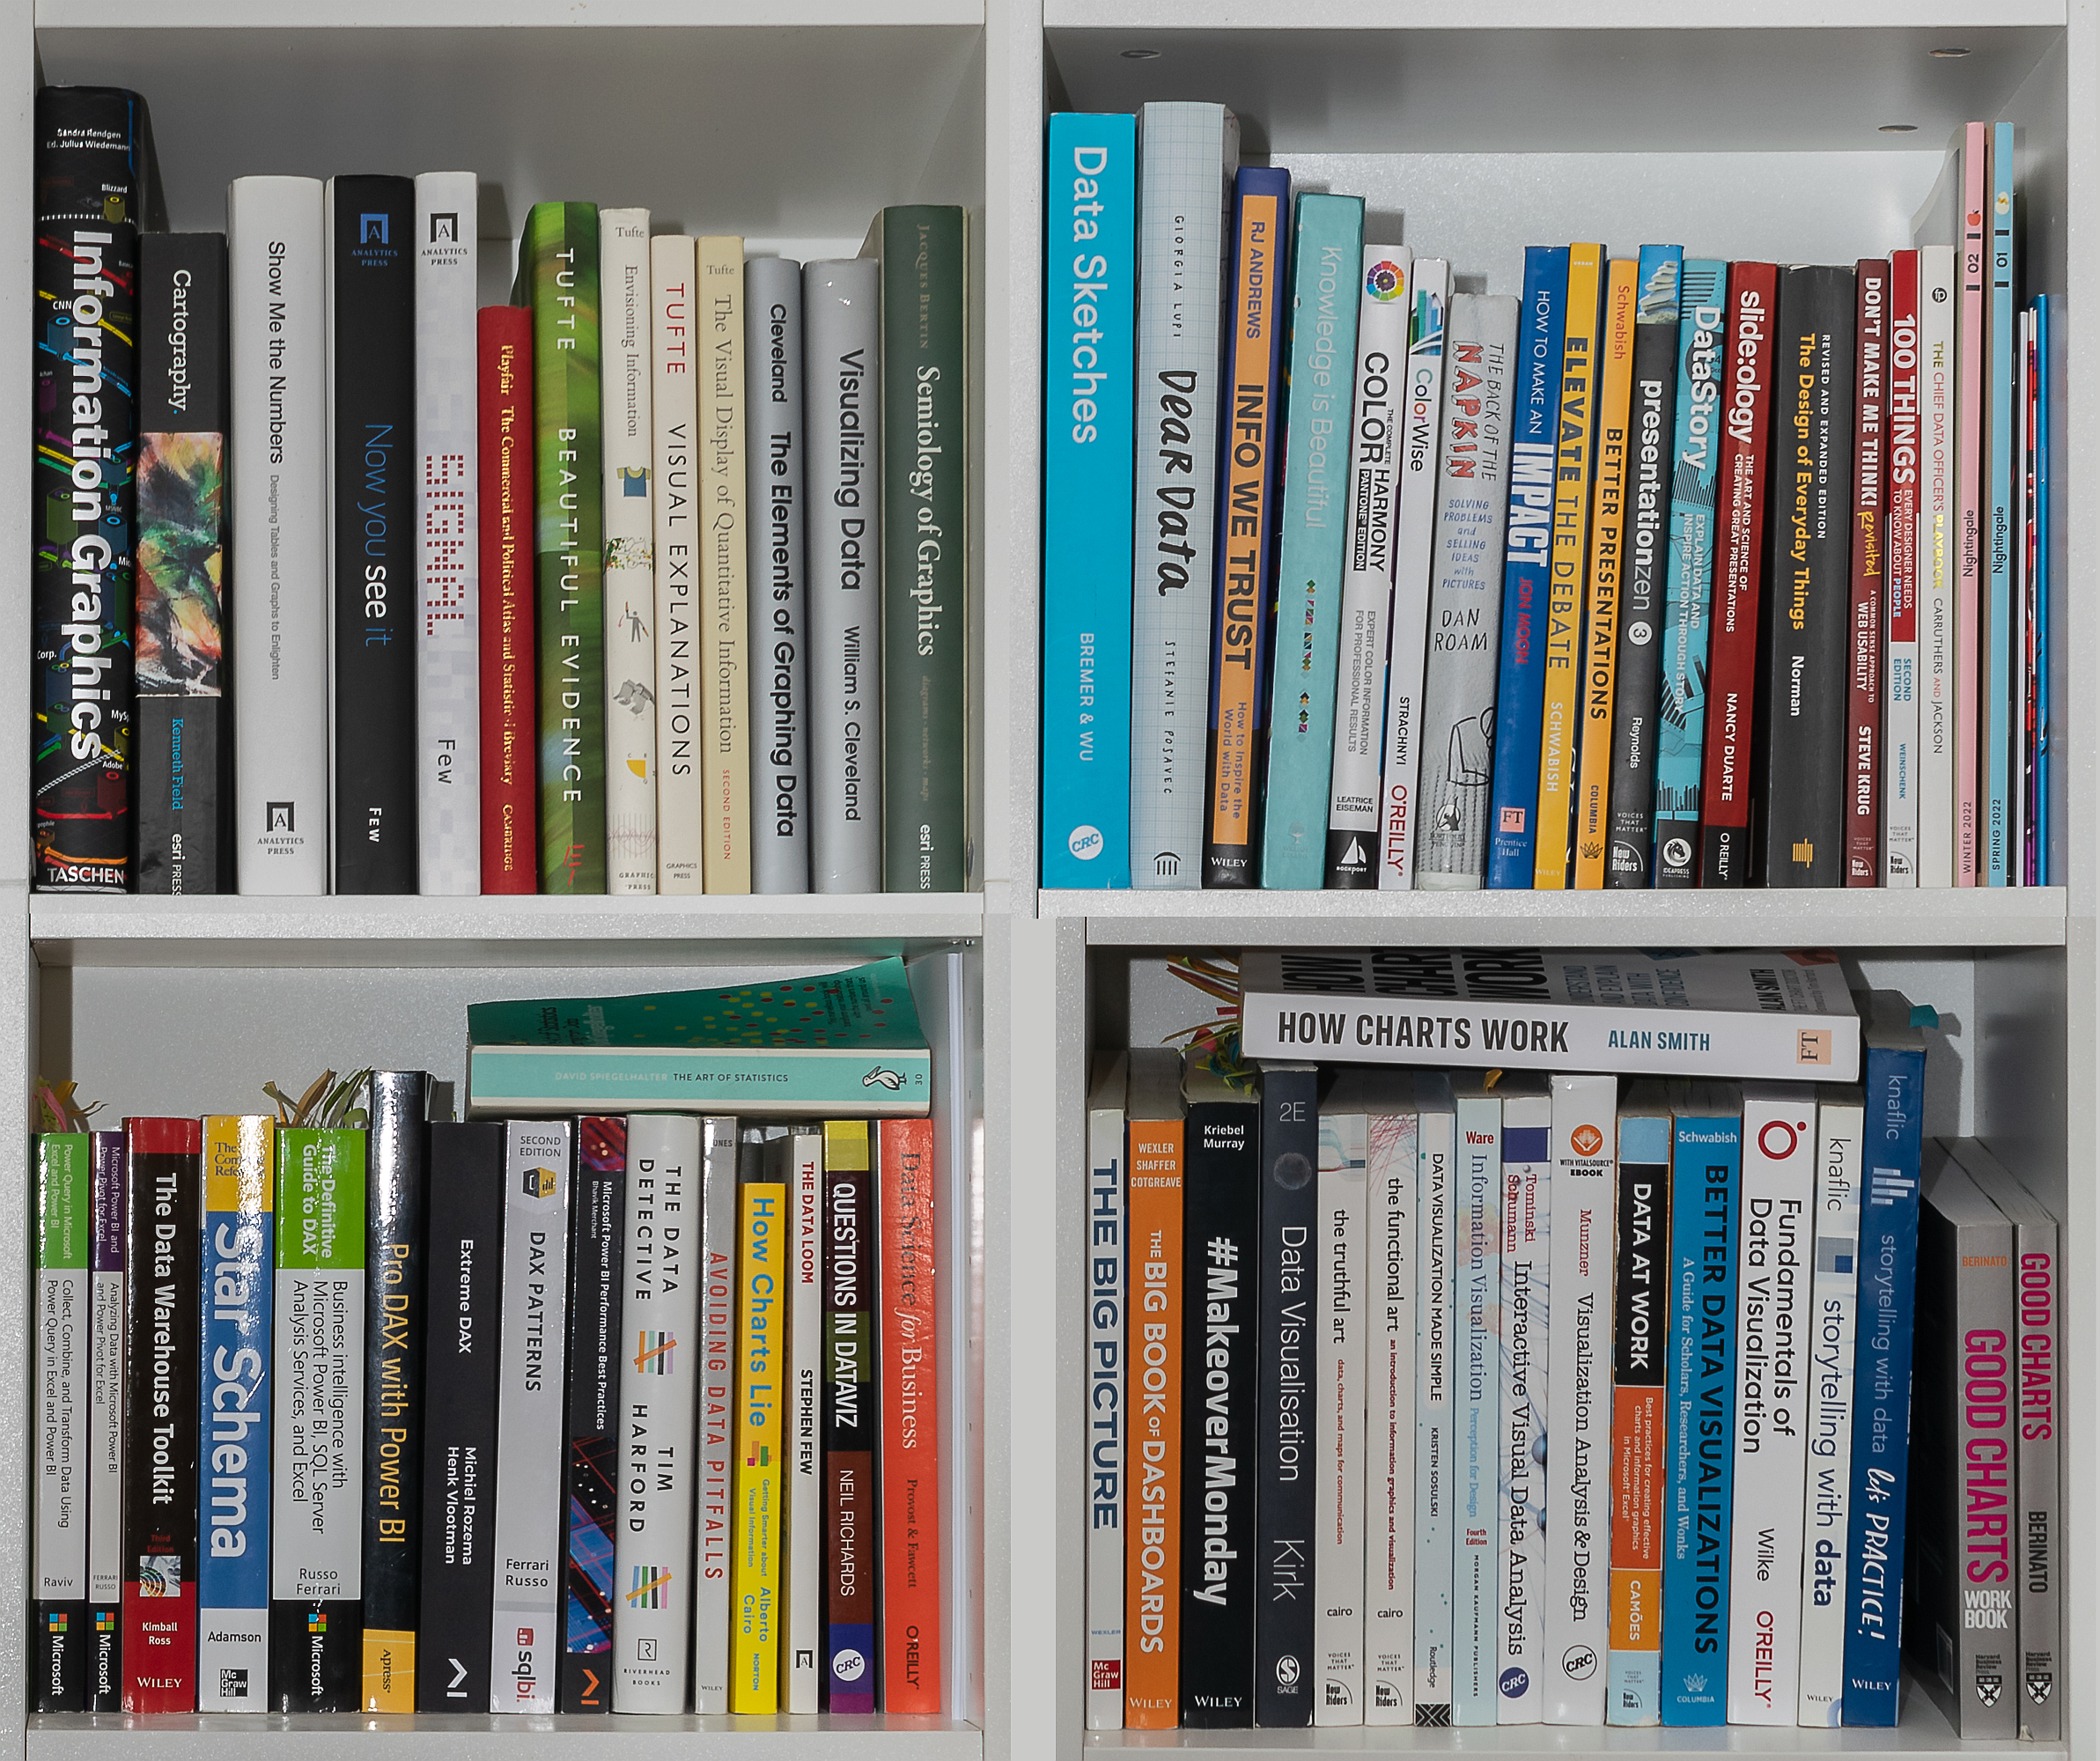
On this page, I catalog and recommend books about data visualization and Power BI. I write only about books from my bookshelf and post only honest, non-sponsored reviews.
A few of these books are specifically tailored to the needs of Power BI developers, covering topics such as Power Query and M language, dimensional data modeling, and DAX. However, most of these books are tool-agnostic, meaning they do not focus on Power BI or any specific data visualization tool. If you’re seeking books with tool-specific step-by-step instructions, like “click File then click Open,” this may not be the right place for you.
The selection here primarily features books that enhance your understanding, shift your perspective, and assist in creating and presenting better charts, dashboards, and reports, although some offer extremely practical recommendations on how to start making better charts right away.
P.S. There is a long list of books I’ve read but have not yet written a review for. However, I’ll try to update this page with more reviews soon.
Book Sets I Recommend


My Book Reviews


Other Books on my Bookshelf (incomplete list)

DAX Patterns: Second Edition
by Marco Russo, Alberto Ferrari

Storytelling with Data: Let’s Practice!
by Cole Nussbaumer Knaflic

The Visual Display of Quantitative Information
by Edward R. Tufte

Functional Art, The: An introduction to information graphics and visualization
by Alberto Cairo

Truthful Art, The: Data, Charts, and Maps for Communication
by Alberto Cairo

How Charts Lie: Getting Smarter about Visual Information
by Alberto Cairo

Show Me the Numbers: Designing Tables and Graphs to Enlighten
by Stephen Few

Now You See It: Simple Visualization Techniques for Quantitative Analysis
by Stephen Few

Signal: Understanding What Matters in a World of Noise
by Stephen Few

Information Visualization: Perception for Design
by Colin Ware

Data Visualisation: A Handbook for Data Driven Design
by Andy Kirk

#MakeoverMonday: Improving How We Visualize and Analyze Data, One Chart at a Time
by Eva Murray, Andy Kriebel

The elements of graphing data
by William S. Cleveland

Visualizing Data
by William S. Cleveland

Semiology of Graphics: Diagrams, Networks, Maps
by Jacques Bertin

Playfair’s Commercial and Political Atlas and Statistical Breviary
by William Playfair

Questions in Dataviz: A Design-Driven Process for Data Visualisation
Author: Neil Richards

100 Things Every Designer Needs to Know About People
Author: Susan M. Weinschenk

Don’t Make Me Think, Revisited: A Common Sense Approach to Web Usability (Voices That Matter)
Author: Krug Steve

Cartography. Kenneth Field

Information Graphics. Sandra Rendgen

Presentation Zen: Simple Ideas on Presentation Design and Delivery (Voices That Matter). Garr Reynolds

Better Presentations Jonathan. Schwabish

The Design of Everyday Things. Donald A. Norman