How Many Colors do we Need for a Good Data Visualization? 4 Books to Read
I recommend seeking an answer in the following books:
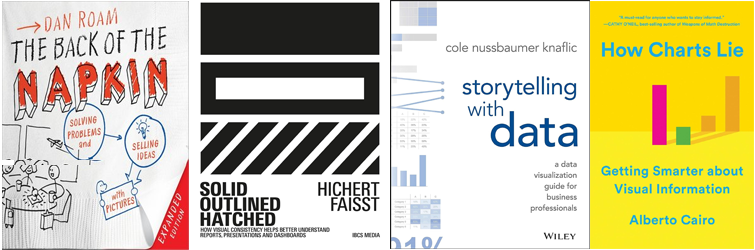
Dan Roam’s “The Back of the Napkin” – an amazing book about solving problems and selling ideas with pictures. Black and Red.

Rolf Hichert, Jürgen Faisst’s “Solid, Outlined, Hatched” – an incredibly practical book about visual consistency that helps better understand reports and dashboards. Black, Red, and Green ones.

Cole Nussbaumer Knaflic’s “Storytelling with Data” – really great guide to data storytelling. Mostly Grey and Blue.

Alberto Cairo’s “How Charts Lie” – an important book about getting smarter – don’t be fooled by the charts and don’t fool others. Grey and Orange.

The list can be longer; these are the most practical and the least colorful ones.