Power BI report to analyze city (property, grocery store etc.) neighbors
In this post I want to show an example of a report that uses hierarchy bridge in the data model with recursive hierarchy. If you don’t know what is recursive hierarchy and hierarchy bridge, see Chapter 10 ‘Recursive Hierarchies and Bridges’ of the Star Schema: The Complete Reference Book By Christopher Adamson book. But I’ll try to explain everything as simple as possible.
A recursive hierarchy is a set of relationships among instances of the same kind of object (or among the individual rows of a table in the data model). In other words it’s a self-reffering relationship. In the Star Schema book you’ll find an example based on a company that owns other companies. It also can be an employee reporting to other employees. In my case I created a dataset based on a list of cities worldwide, just because there were open data (a list of cities with their latitude and longitude). But the same data modeling approach will be useful for any other objects (properties, grocery stores etc.) if you want to analyze them on two levels (any object – level 1, neighbors of the selected object – level 2).
I created dummy data based ‘Price’ table with some prices for each city (prices also vary by different colors and dates). Lets say I want to be able to see average prices for any selected city and then for its neighbors (all cities within 1000 km radius from the selected city). In this data model cities have relationships with other cities. There are different ways to handle this situation, but a hierarchy bridge and two aliases of the city table is what works really well.
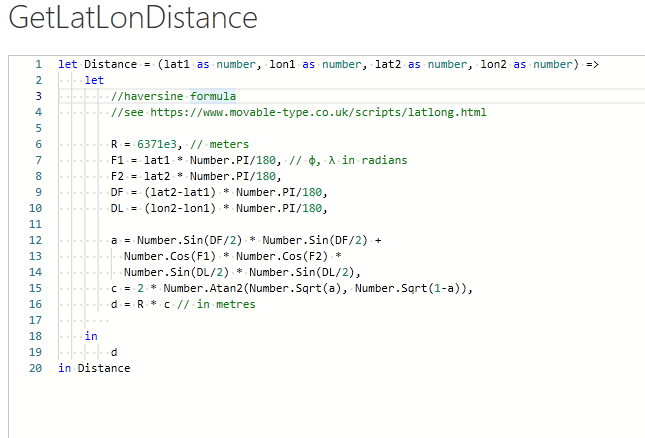
I downloaded a CSV file with a list of the cities (with latitude and longitude for each city) from https://simplemaps.com/data/world-cities web page and then used custom M language function in Power Query to calculate distances between cities.
Having distances between cities I created ‘Neighbor’ table with a list of neighbors of each city:
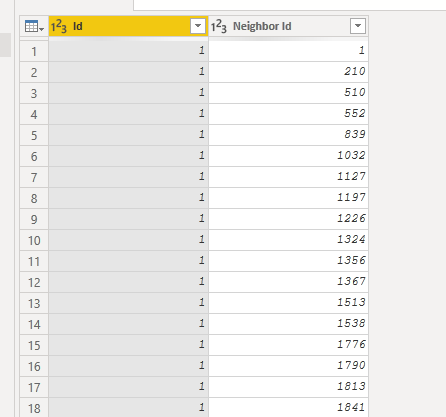
It’s a table with 2 columns and for each ‘Neighbor'[Id] value there are multiple ‘Neighbor'[Neighbor Id] values to list of neighbors of the ‘Neighbor'[Id] city (including ‘Neighbor'[Id] city itself).
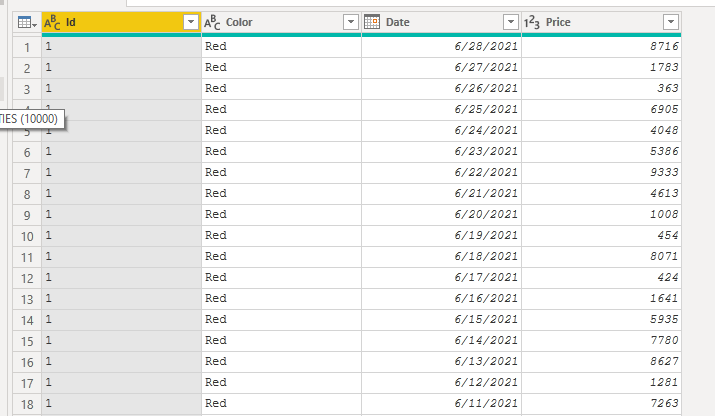
Also I created ‘Date’ and ‘Color’ dimension tables and generated (using random numbers) prices for the ‘Price’ table.
This is my data model:
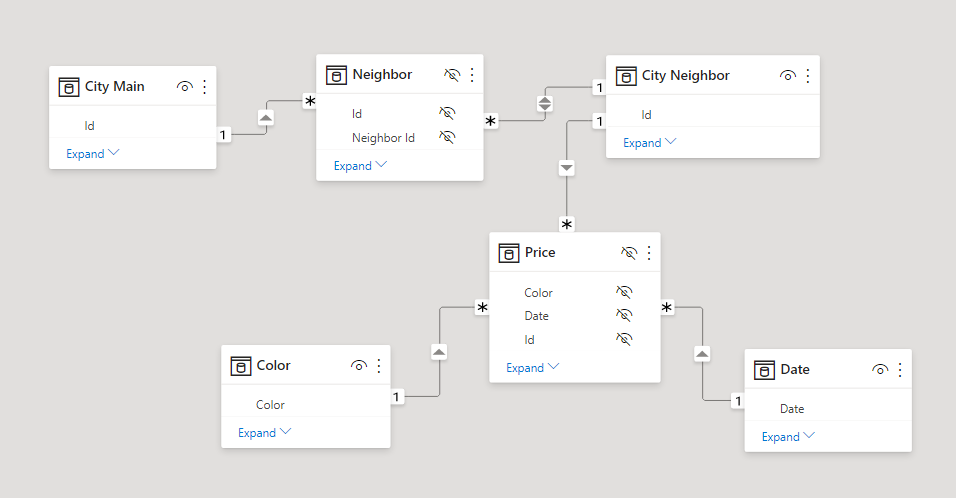
I contains a simple star schema: ‘Price’ fact table, ‘Color’ and ‘Date’ dimension tables and also originally there was only ‘City Neighbor’ dimension table created in Power Query. But, to be able to analyze city neighbors I need two copies of the city table: ‘City Neighbor’ and ‘City Main’. I created a copy of the city table as a calculated table, so basically ‘City Main’ is an alias for ‘City Neighbor’ table. Also there is a bridge table ‘Neighbor’. ‘Neighbor’ table have 2 columns: ‘Neighbor'[Id] and ‘Neighbor'[Neighbor Id]. For each ‘Neighbor'[Id] there is a bunch of ‘Neighbor'[Neighbor Id] values. In other words for each ‘City Main’ we have a list of ‘Neighbor City’ cities located within 1000 km range from this city.
This data model allows me to filter my fact table either by a city from the ‘City Main’ table or by its neighbors. Take into account that for ‘Neighbor’ *-1 ‘City Neighbor’ relationship I enabled 2 ways cross filtering, because my goal is to analyze cities starting from ‘City Main’ and then drilling through to the city neighbors (from the left to the right in my data model).
Then it was easy to build the visual part of the report:
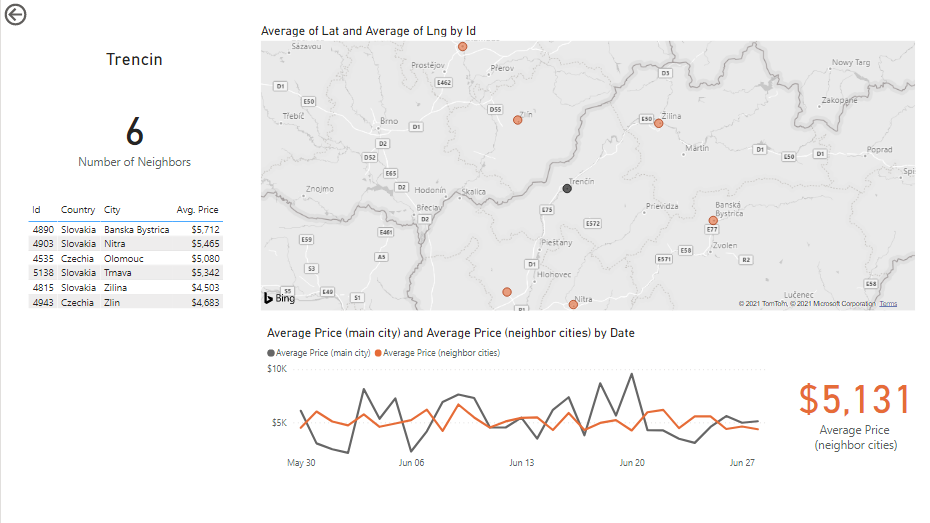
On page ‘All Cities’ I have a slicer by ‘City Main'[Country] column, so I can select a country and then a city from the table (or on the map). When one city is selected I can drill through to ‘Neighbors’ page.
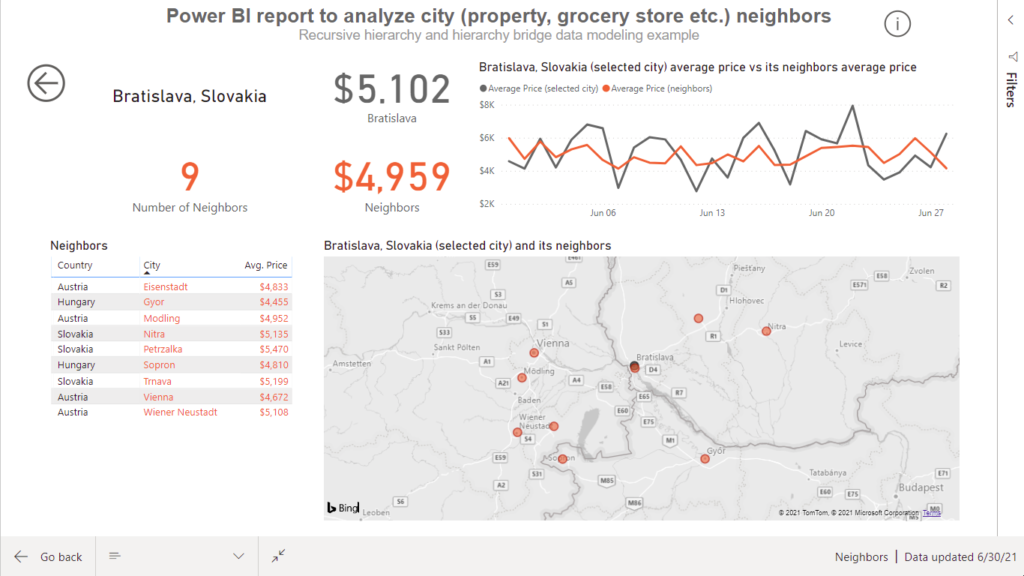
On the neighbors page I have a card visual with a name of the selected city, number of its neighbors and a table with a list of the neighbors. Also, on the map there are bubbles for all neighbors (orange) and for the selected main city (black). And I can compare neighbors prices with the main city price.
To make all the above working I needed some DAX measures.
Simple measure to just show what main city I selected:
Selected City (main) :=SELECTEDVALUE ( ‘City Main'[City] )
A bit more complicated measure to get number of neighbors:
Number of Neighbors :=CALCULATE (
COUNTROWS ( ‘City Neighbor’ ),
–exclude main city (count only neighbors)a
FILTER (
‘Neighbor’,
‘Neighbor'[Id] <> ‘Neighbor'[Neighbor Id]
)
)
I this measure I had to use a FILTER to exclude ‘Neighbor’ table records with the same value in ‘Neighbor'[Id] and ‘Neighbor'[Neighbor Id] columns (to exclude main city itself and to count only its neighbors).
To be able to apply different colors to the main city and it’s neighbors I used the following measure:
IsMainCity :=//0 – neighbor, 1 – main city
VAR _SelectedCityMain =
SELECTEDVALUE ( ‘City Main'[Id] )
VAR _SelectedCityNeighbor =
SELECTEDVALUE ( ‘City Neighbor'[Id] )
VAR _Result =
INT ( _SelectedCityMain = _SelectedCityNeighbor )
RETURN
_Result
It returns 1 if the selected city in ‘City Neighbor’ table and the selected value in the ‘City Main’ tabel is the same city (main city) and else 0 (city neighbors).
This measure calculates average price for neighbors:
Average Price (neighbor cities) :=//neighbor city average price
CALCULATE (
AVERAGE ( ‘Price'[Price] ),
FILTER (
‘Neighbor’,
–include only neighbor city (exclude main city)
‘Neighbor'[Id] <> ‘Neighbor'[Neighbor Id]
)
)
Again, I’m excluding the main city from the list of its neighbors.
And finally a measure to calculate average price for the main city:
Average Price (main city) :=//main city average price
VAR _MainCity =
SELECTEDVALUE ( ‘City Main'[Id] )
VAR _MainNeighborCity =
FILTER (
ALL ( ‘City Neighbor’ ),
–include only main city itself (exclude neighbors)
‘City Neighbor'[Id] = _MainCity
)
VAR _PriceM =
CALCULATE ( AVERAGE ( ‘Price'[Price] ) )
VAR _PriceN =
CALCULATE ( AVERAGE ( ‘Price'[Price] ), _MainNeighborCity )
VAR _Result =
IF ( ISBLANK ( _MainCity ), _PriceM, _PriceN )
RETURN
_Result
In this measure, if main city is not selected yet (I’m on the ‘All Cities’ page) then it just AVERAGE of the price. And if a city selected, then we need to exclude neighbors and get AVERAGE of the price only for the selected city.
This is not an easy topic, so I probably will need to update this post when I know what questions people have. Feel free to ask any questions.
You can download .pbix file here: https://dl.dropboxusercontent.com/s/k5xur6knly0k8lh/Neighbors.pbix