3D and animation in Power BI?
I was writing just a comment (about 3D cursed BI tools) in LinkedIn, but it’s going to be more than just a short comment, so I will post my thoughts here.
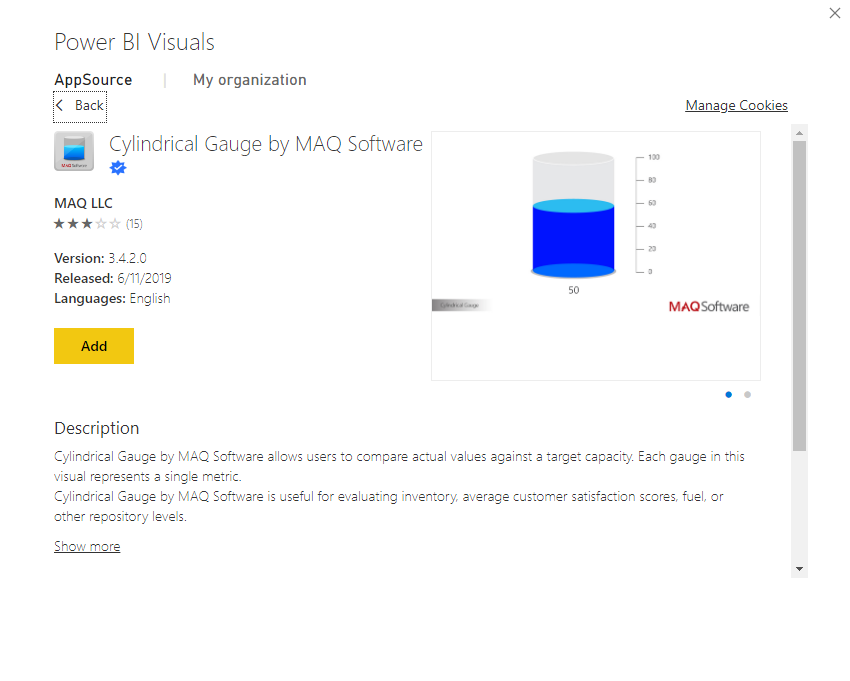
If you use 3D and animation to visualize just a number or two then the numbers itself are meaningless for you / your customer and it’s all about entertainment. Additional dimension adds nothing but distraction to what can be represented with just a text or an object on 2D plane (dot, line, bar). Animation, if it doesn’t represent a meaningful process, just multiplies the distraction.
3D + animation in data visualization make sense only when you have a lot of numbers (e.g. continuous data) and all dimensions are really meaningful for the process described by the numbers (e.g. aerodynamic simulation of a wind turbine or a rocket). In most cases, if you need 3D animation, it’s not about BI and Power BI is not your tool.
I was ready to make 3D pie charts for my clients in the past just because they wanted and were ready to pay for this work (it didn’t really happen more than once, but I was ready to do so). But I changed my mind. Now I will say “No, my job is to make numbers meaningful an helpful and I believe that what you’re asking for will just add distraction and nothing more.” While I’m not a single source of truth, if I’m a data visualization professional than it’s my job to use my know how to build what I believe will be the most efficient solution for converting raw data into insights. I’ll be happy if the solution I created will help a client to improve a business process, I won’t be happy just because of “I like it! It’s a cool 3D animation!”, even if I’ll be working for Disney (as a BI developer).
While 3D and animation sometimes are cool for people (just because of “look what this modern BI tool can do!” effect) you need to think twice before adding them to your data visualization.
Question to ask yourself before adding any 3D object or animation to your data visualization:
- Will 3D or animation give the end users any additional meaningful information about the object or process behind the data?
- Can I explain the same numbers by just text or objects on 2D plane (dot, line, bar) without loosing any meaningful information?
- Will the end users need more time to understand 3D (animated) visualization?
- Will 3D or animation add any distraction or uncertainty?
- Who are the end users and what they really need? Are you sure they need what you has been asked for? (maybe you didn’t communicate with them directly, maybe the client knows what is cool, but has no experience in what is useful, actually you has been hired because you know better)
- Am I looking for an answer to a good question? Maybe instead of answering a question “How can I improve this bar chart? Should I add 3D and animation?” you need another question. Another chart. Not a chart at all. Another measure. Question your question.